

Finding the right Scope 3 emission software is now a top priority for businesses in India. Scope 3 emissions in India typically carry 70-90% weightage of a company’s total emissions footprint. Scattered calculation checkpoints leave companies with no option but to rely on estimates and reporting processes that become hard to scale as quality assurance increases.
While internal operations data produces Scope 1 and Scope 2 emissions numbers, Scope 3 needs information from logistics partners, contractors, and other entities across the value chain.
This article reveals six common mistakes Indian organizations continue to make without Scope 3 emissions category 1 to 15 reporting tools in India.
Why Calculating Scope 3 Emissions in India Differs from Scope 1 & 2
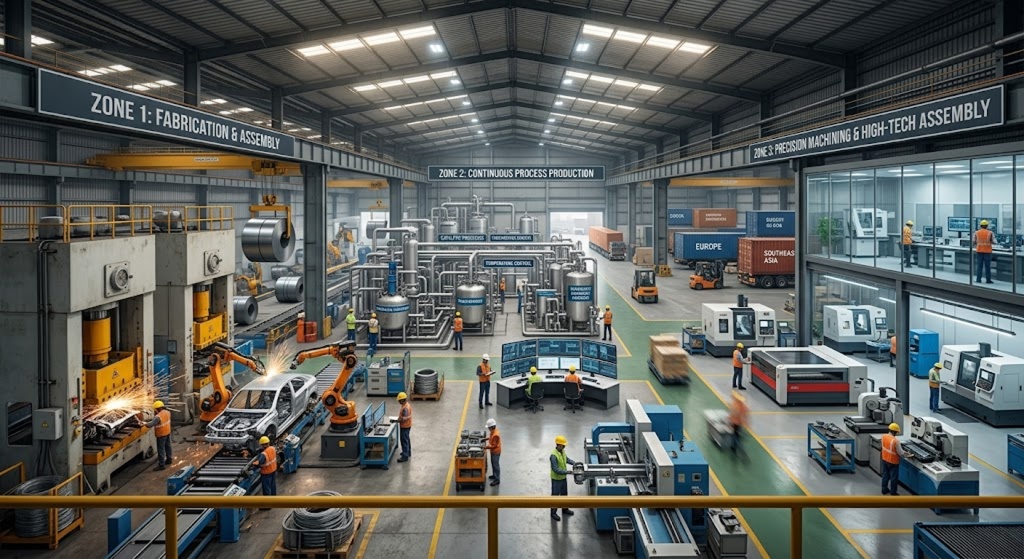
Collective cross-border emissions data tracked by the World Resources Institute (WRI) states 75% of total GHG emissions across major worldwide business verticals are Scope 3. And companies struggle with these calculations because the data sits outside their company.
A sustainability team may know its diesel consumption, electricity bills, and refrigerant purchases within days. Those records generally stay inside ERP systems and facility databases. However, Scope 3 reporting is different. The largest emissions sources often sit with suppliers, transport providers, contract manufacturers, distributors, waste handlers, and customers.
A Scope 1 or Scope 2 reporting project may require coordination across a handful of internal stakeholders. Whereas a Scope 3 reporting exercise for categories 1 to 15 can involve hundreds of suppliers placed beyond borders, where each operates with different emissions maturity levels. Few suppliers may provide product-level emissions, but data-averse ones may barely have energy consumption records.
This is why Scope 3 projects frequently stall after the first reporting cycle. Initial disclosures may be completed using estimates and spend-based calculations. As the 2nd year begins, investors start asking for methodology explanations and auditors request evidence trails. Furthermore, conscious customers ask for product-level emission reveals, and the workload moves from carbon accounting to supplier communications and reporting scalability.
Treating All 15 Categories as Equally Material (Mistake #1)
Many ESG reporting teams create data collection pipelines across all 15 Scope 3 emissions categories together. Months are spent gathering low-impact data while major emissions sources remain poorly understood.
Many organizations also confuse disclosure with data maturity requirements. While all categories should be assessed for relevance, not every category requires the same level of data granularity during the early stages of a Scope 3 program.
For a steel manufacturer, Category 1 (Purchased Goods & Services) and Category 4 (Upstream Transportation) often dominate the footprint. But IT companies, compared to capital goods, see far greater emissions via business travel, employee commuting, and purchased services. Similarly, financed emissions in Category 15 for the BFSI sector can dwarf emissions from offices and operations.
Depending Entirely on Spend-Based Estimates (Mistake #2)
If you make spend-based calculations your standard reporting strategy, you’re not honestly sharing the actual carbon intensity of your suppliers. Too many enterprises estimate emissions by multiplying supplier spend by industry-average emission factors. This only fulfills part of the initial Scope 3 emissions disclosure requirements.
Let’s consider a logistics comparison. Two transport providers may charge similar rates for moving goods between Mumbai and Chennai. The first operates an older diesel-heavy fleet, but the other has strategically invested in route optimization and lower-emission vehicles. Though reporting Scope 3 value chain emissions requires precise data on emissions performance, spend data will only capture invoices in this case.
This becomes a problem when procurement teams begin supplier engagement programs or attempt value chain decarbonization initiatives. Decisions are made using financial proxies rather than operational realities.
Starting Supplier Engagement Too Late (Mistake #3)
There’s a common pattern when preparing for SEBI-mandated BRSR or BRSR Core reports in India. The reporting deadline is six weeks away, and the procurement team is receiving requests for supplier emissions data. As suppliers respond that they’ve never measured it before, sustainability teams fall back on generic emission factors and assumptions that become difficult to defend later.
ESG-compliant companies segment suppliers before launching data collection efforts. High-spend or high-emission suppliers are engaged first. Then, clear guidance is provided on the required and preferred data and calculation methodologies. Some organizations even build emissions reporting requirements directly into supplier onboarding and procurement processes.
Bring in a unified software solution with supplier, employee, and customer portals to track and share all Scope 3 emissions from a single channel. Scope 3 Emission Software by The Sustainability Cloud is a supplier emissions data-collection platform in India that lets you standardize all data via the PACT data exchange API. What’s best, you can personalize your own emission database or choose from 20+ standard, in-built LCI emission factor databases.
Mapping Data to the Wrong Scope 3 Categories (Mistake #4)
A company may report emissions from 3rd-party warehousing under Category 1 (Purchased Goods & Services) if the warehouse vendor issues an invoice. Another team may classify the same activity under Category 4 (Upstream Transportation & Distribution) because it falls within their logistics framework.
Likewise, many companies categorize cloud computing expenses or leased assets in ways that seem logical internally. Unfortunately, they don’t align with the GHG protocol. Assurance reviews tend to spot these mapping errors as emissions are either double-counted across categories or omitted entirely because different teams assume it’s already been reported.
Bonus Read: PCAF Carbon Accounting Methodology: Only Guide Needed for Financial Institutions
Ignoring Downstream Categories Until Reporting Season (Mistake #5)
What happens after products leave the factory gate? Knowing this takes research and time-tested processes. For instance, a consumer electronics company may spend months collecting data from component suppliers. Few years later, it discovers that the electricity consumed using its products over 8-10 years creates a far larger emissions footprint.
Even B2B companies are victims of the downstream emissions trap. A chemical manufacturer may know exactly how much energy was used to produce a specialty chemical. But they have little to no visibility into the released emissions once customers use or dispose of the product.
By the time reporting season arrives, teams suddenly realize Categories 9, 10, 11, or 12 are their primary footprint. Keep in mind, customer usage patterns and end-of-life data cannot be gathered in a few weeks.
Managing Scope 3 Emissions in India via Spreadsheets (Mistake #6)
The cycle is undeniably messy. A sustainability manager requests supplier data that gets updated by procurement teams. Plant teams maintain separate files and finance updates emission factors. That new external consultant sends another spreadsheet. No department is sure anymore of which file has accurate numbers.
Now multiply that across five manufacturing plants and three business units partnering with 100s of suppliers. Your best bet here is version control.
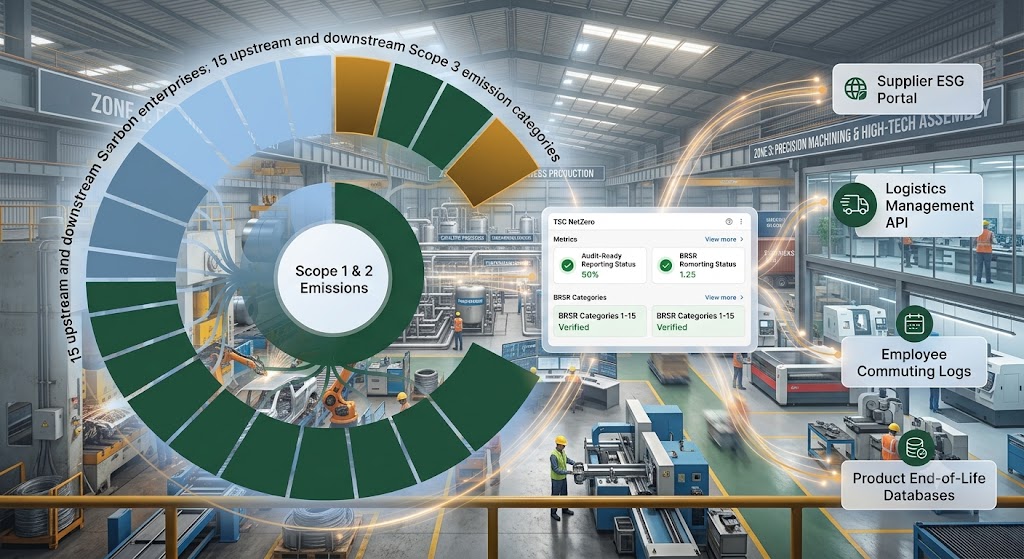
To see how Scope 3 emissions category 1 to 15 reporting tools in India can set you up for regulatory victories.
Conclusion: Turning Scope 3 Compliance into a Competitive Advantage
Navigating Scope 3 emissions in India no longer has to feel like a compliance burden. While mapping and calculating emissions across Categories 1 through 15 presents unique data challenges, moving away from manual spreadsheets and spend-based estimates is the first critical step toward audit-ready reporting.
By leveraging dedicated Scope 3 emission software, Indian enterprises can establish seamless, automated data pipelines directly with their value chain partners. This not only ensures seamless alignment with SEBI’s BRSR requirements but also uncovers real decarbonization opportunities that protect your business from future climate risks.
FAQs